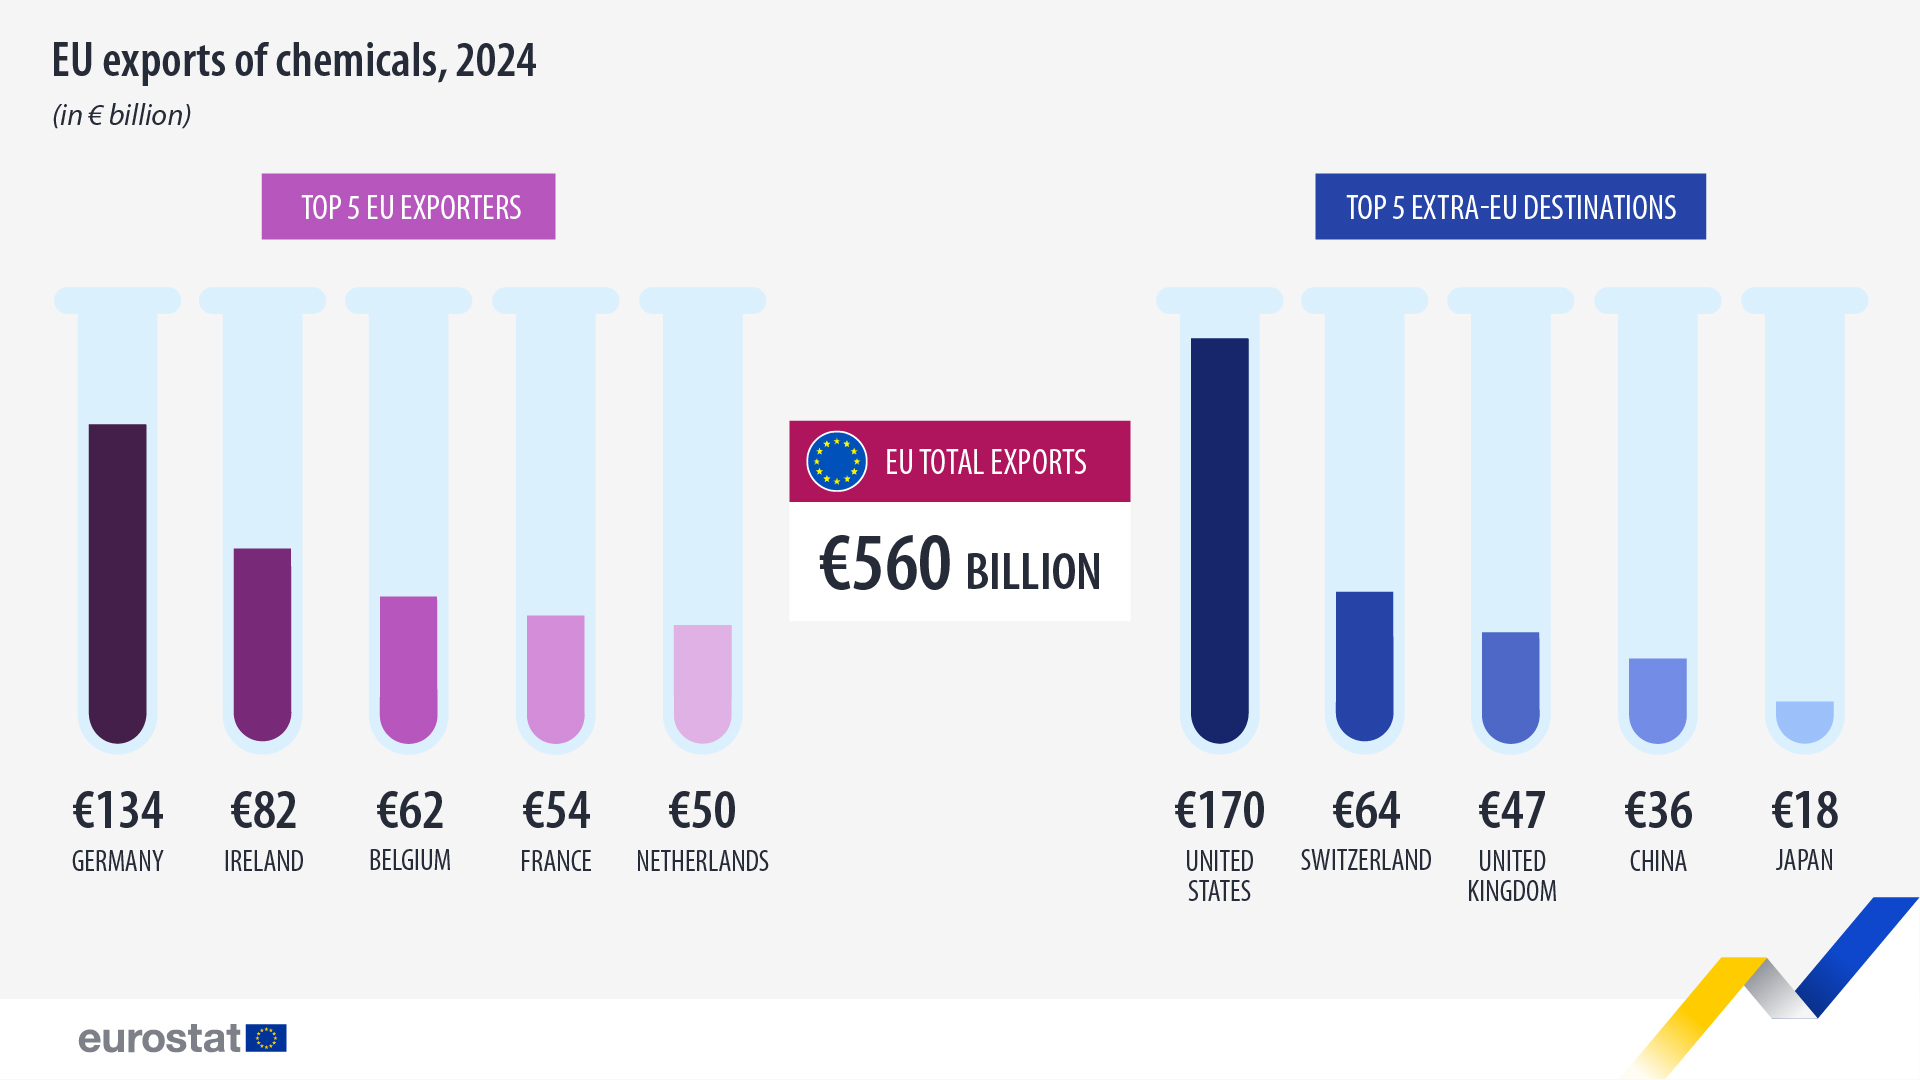
EU exports of chemicals and related products to non-EU countries reached a record €560 billion in 2024, up 7% from €523 billion in 2023, while imports fell 1% to €322 billion, according to Eurostat data. For overseas buyers, this signals sustained EU competitiveness in high-value chemical segments and potential shifts in supply dynamics for key trading partners like the US and China.
Export growth drivers
Germany led EU chemical exports with €134 billion, followed by Ireland (€82 billion), Belgium (€62 billion), France (€54 billion), and the Netherlands (€50 billion). The United States remained the top destination at €170 billion, with Switzerland (€64 billion), the UK (€47 billion), China (€36 billion), and Japan (€18 billion) also significant markets.
Import trends and top importers

EU chemical imports from non-EU countries declined 1% to €322 billion in 2024. Germany was the largest importer at €56 billion, ahead of Belgium (€45 billion), the Netherlands (€43 billion), Italy (€34 billion), and Slovenia (€29 billion). The slight import drop may reflect weaker demand or inventory adjustments in key European markets.
What buyers should watch
The "Rotterdam effect" inflates Dutch and Belgian trade figures due to quasi-transit goods passing through their ports. Buyers sourcing from or through these countries should verify origin data. The strong EU export performance, especially to the US and China, suggests continued availability of high-quality chemicals, but importers should monitor trade policy shifts and logistics costs.

Compliance and logistics signals
EU chemical trade data covers organic and inorganic chemicals, pharmaceuticals, plastics, fertilizers, and other related products. For non-EU buyers, understanding these trade flows helps assess supply reliability and pricing trends. The record export level may also influence REACH-related supply chain decisions, as EU producers remain dominant in specialty and regulated chemical markets.
Source: Read the original report | Published: September 29, 2025